
Details
Stitched Through Time
Stitched Through Time: The Evolution of Embroidery, is a comprehensive infographic that details the history of embroidery through chronological storytelling. The visual incorporates icons, colour and motifs that help identify certain themes and visuals related to the craft. The data pulls from global information, spanning from North America to Asia. The infographic uses both location and time based data to illustrate the visual narrative.
The goal of the infographic is to help users understand the history of embroidery in a condensed, efficient and engaging way. Colour, motifs and themes help to make the image less word dense and more about the visuals. The challenge was condensing so much information in a way that didn’t exclude anything important and only showed the most pertinent points of chronological history.
Services
Infographic Design
Year
2025
Client
-
Mission
"Synthesize the evolution of embroidery into a cohesive narrative, using data visualization and storytelling to highlight the cultural, economic, and artistic significance."
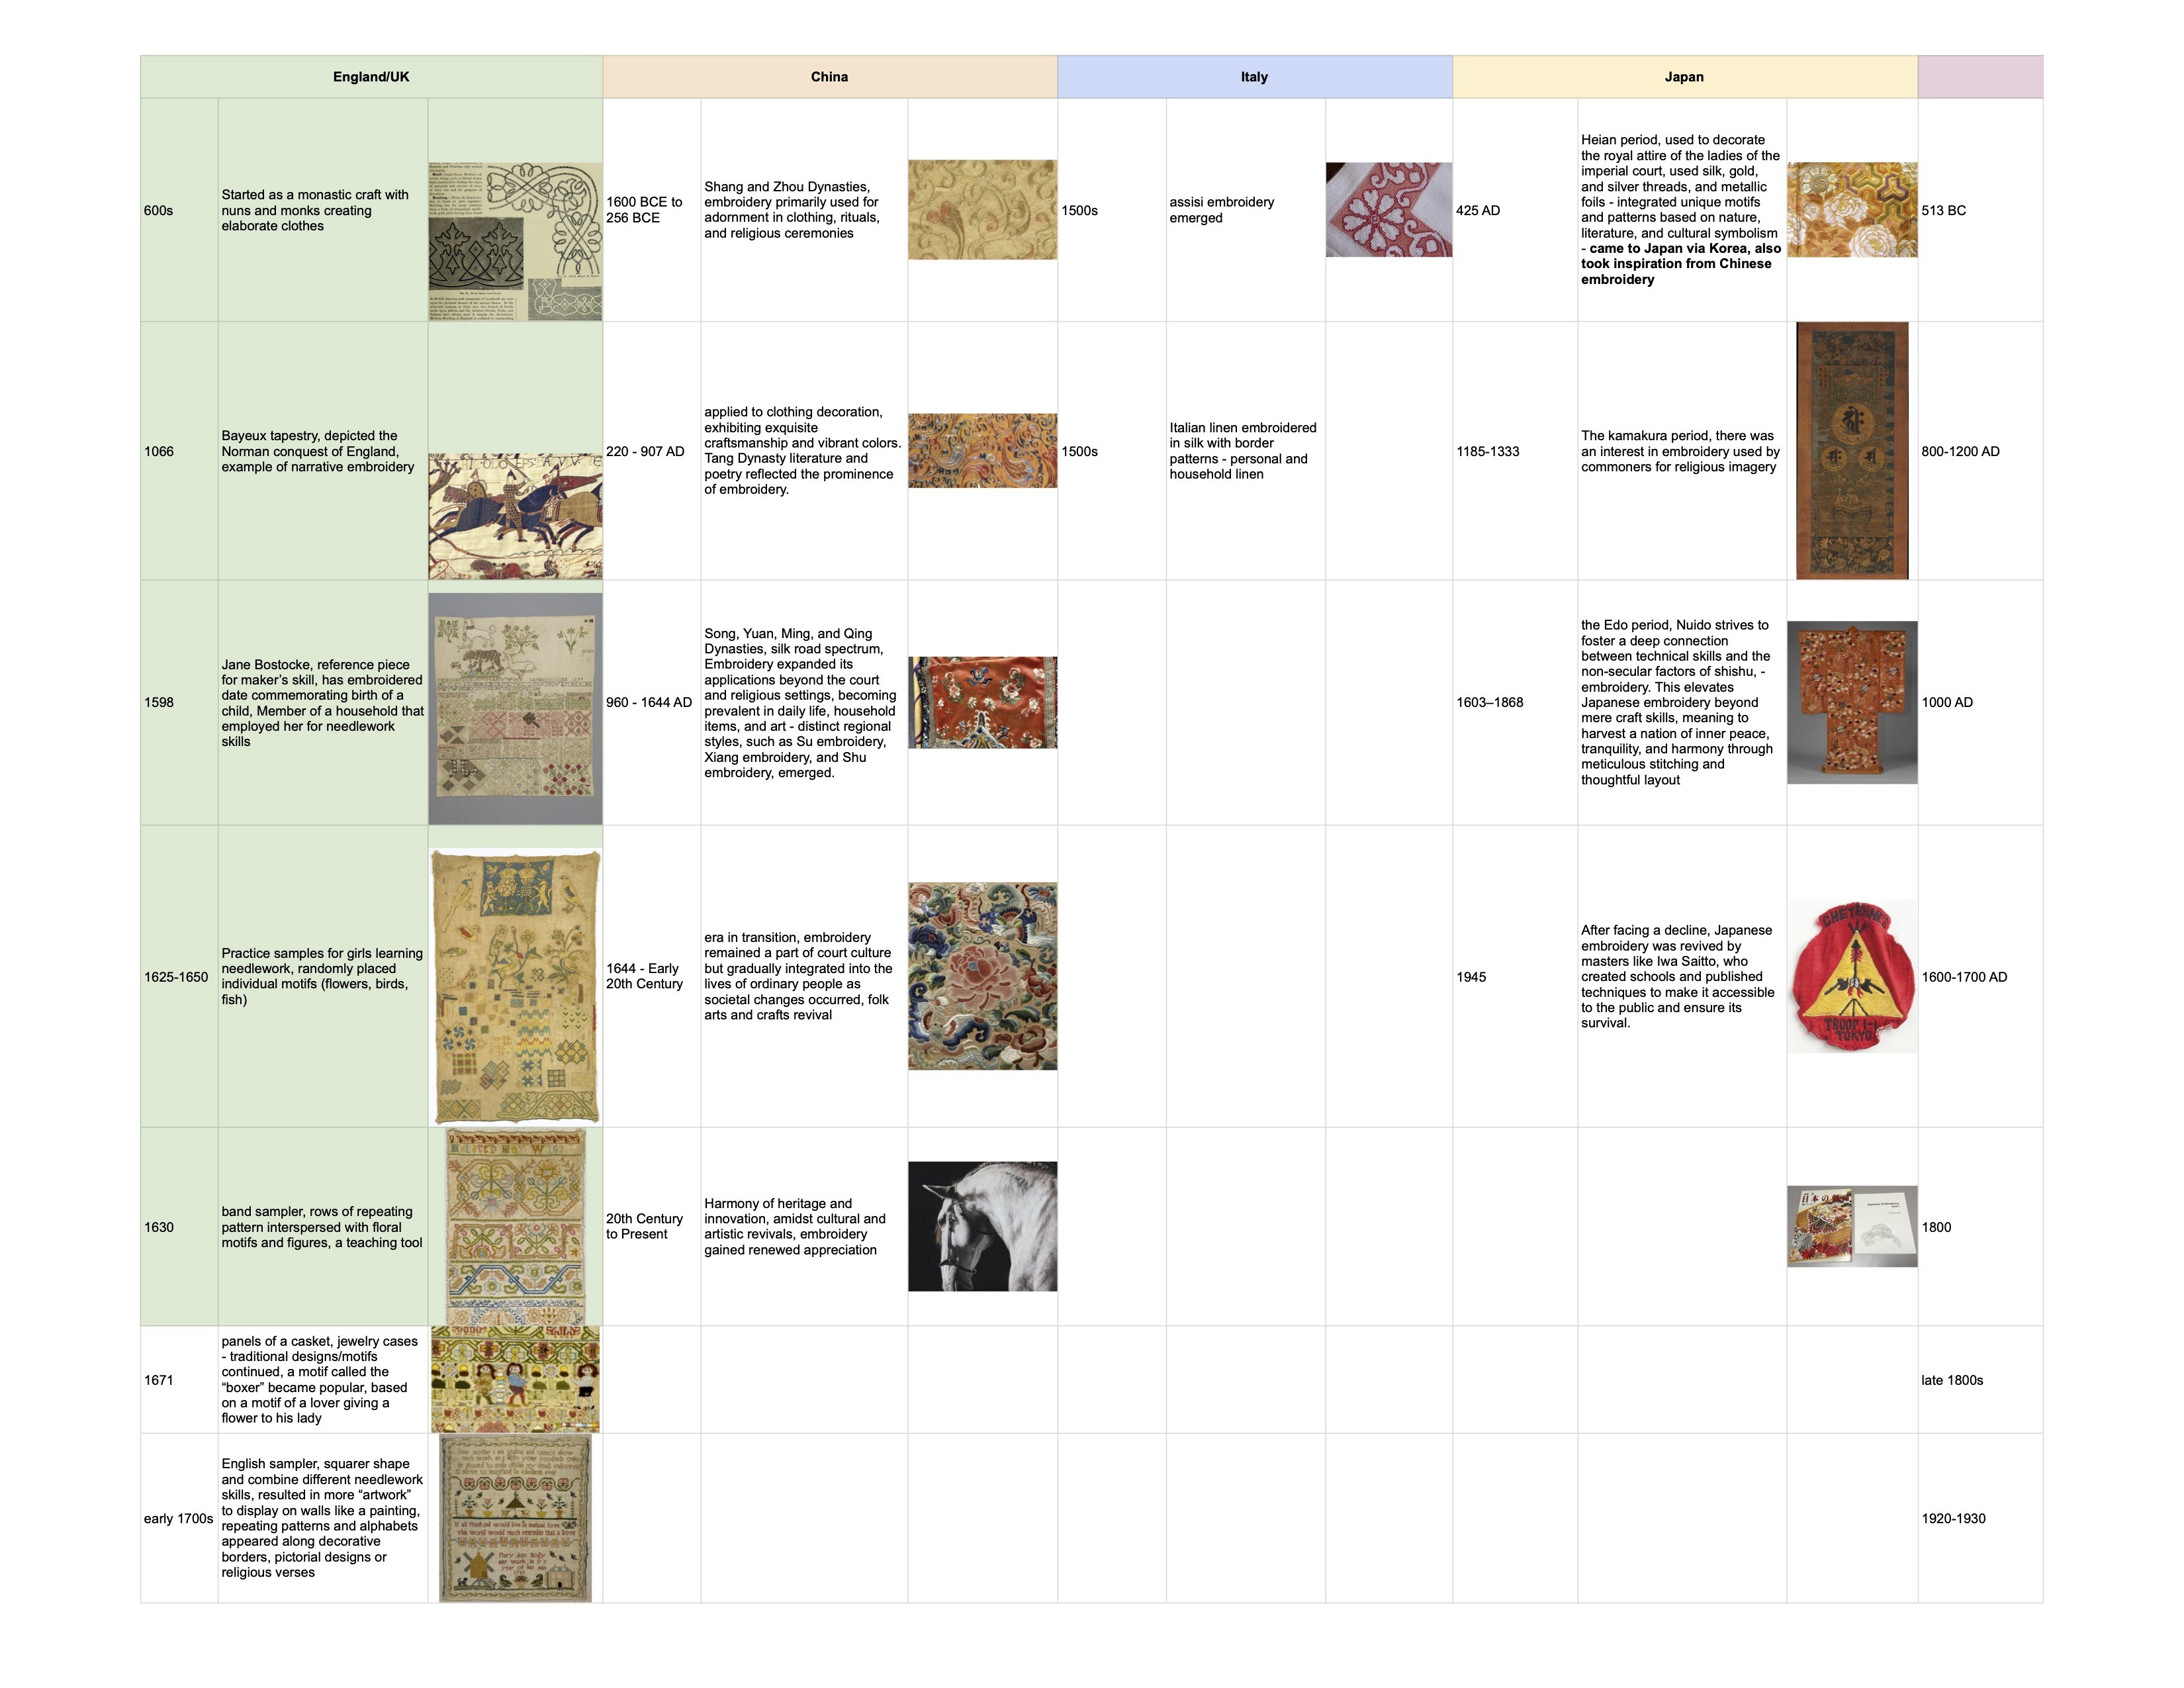
Data collection and organization. This was imperative to make sure only the necessary information was included and in the proper order.

Initial concept sketches for the layout of the infographic.

Initial concept sketches for the layout of the infographic.
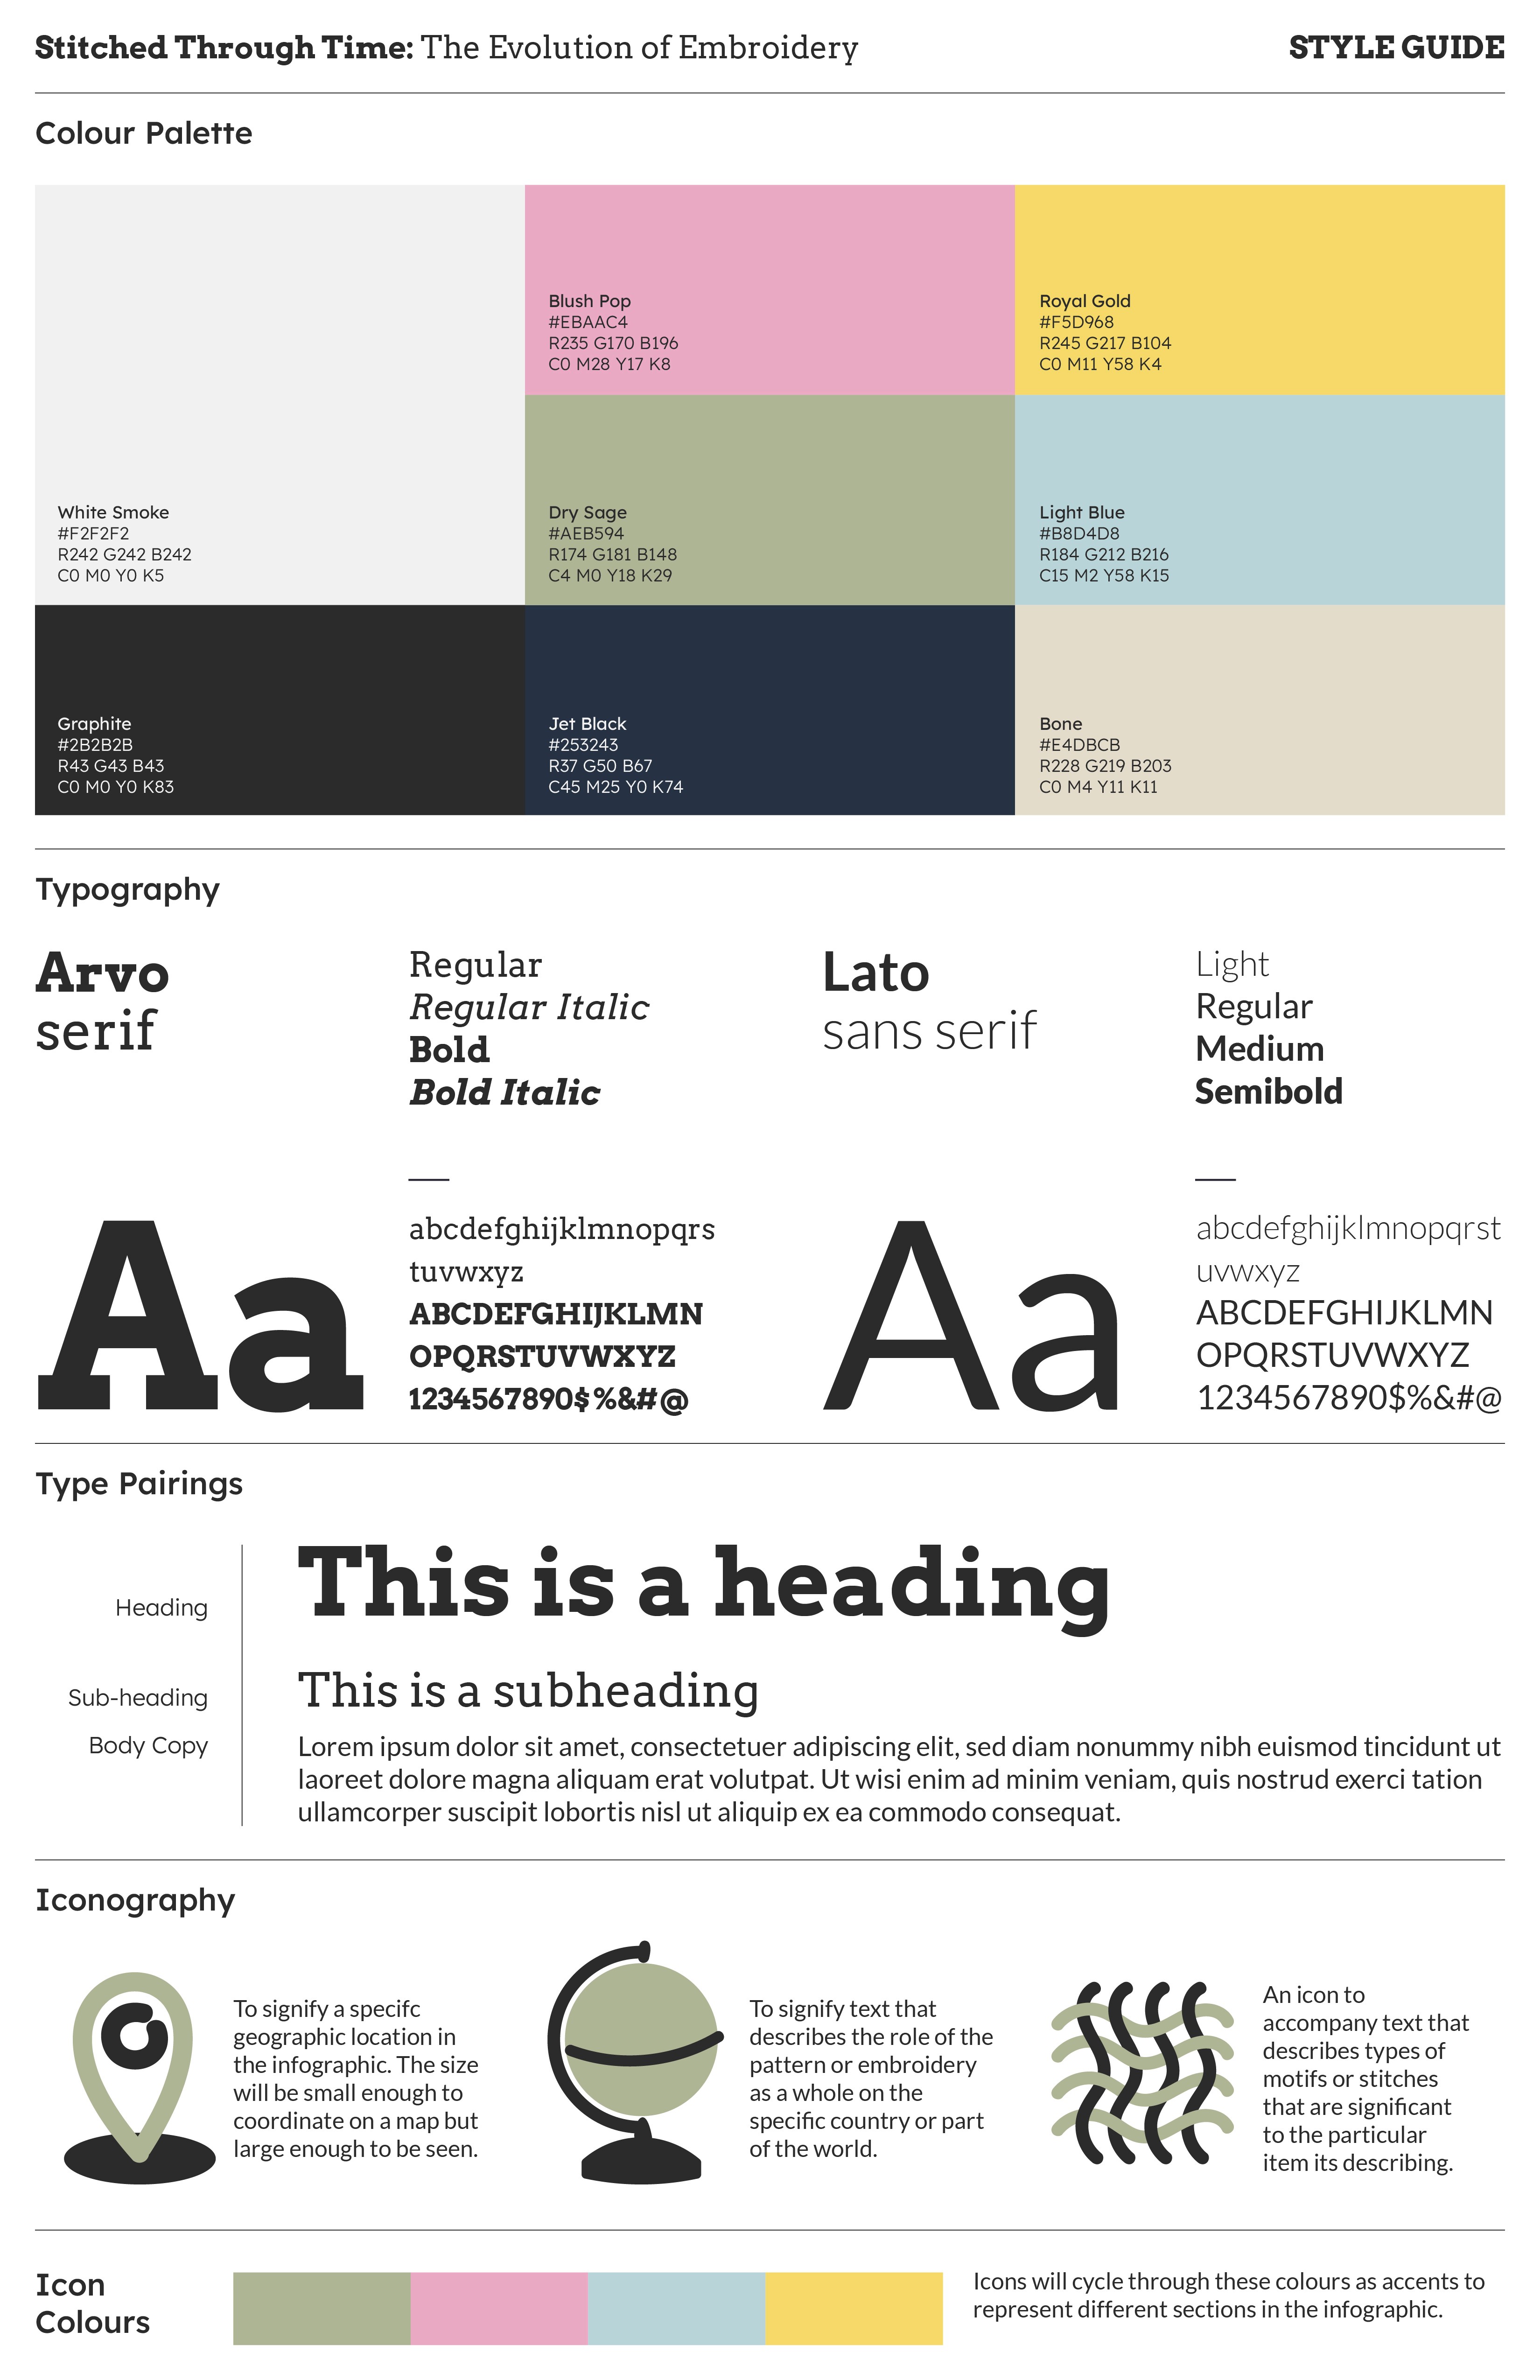
Infographic style tile outlining all brand aspects.

Final infographic